LoadingThe content.Poxfy dashboard is your primary hub for real-time business insights. It provides a comprehensive overview of sales performance, key metrics, and operational trends.
Key Metrics Displayed:
Today & Yesterday: Compares today's sales with yesterday's performance.
This Week & Last Week: Monitors weekly trends and growth.
This Month & Last Month: Tracks monthly performance and changes.
This Year & Last Year: Analyzes year-over-year growth.
Sales Growth Rate: Percentage increase/decrease over the last three months.
Average Transaction Value: The average amount a customer spends in a single transaction.
Sales Overview: A quick snapshot of recent sales activity.
Step-by-step Instructions:
Upon logging in, you will automatically be directed to the Dashboard.
.
Review the prominent cards displaying key sales metrics for different periods.
Observe the comparative data to understand performance trends.
Analyze the Sales Growth Rate and Average Transaction Value for deeper insights.
To filter dashboard data by outlet, click on the Outlet Selector in the top navigation bar and choose the desired outlet.
Use the Quick Add button (+) in the top bar to quickly initiate common actions.
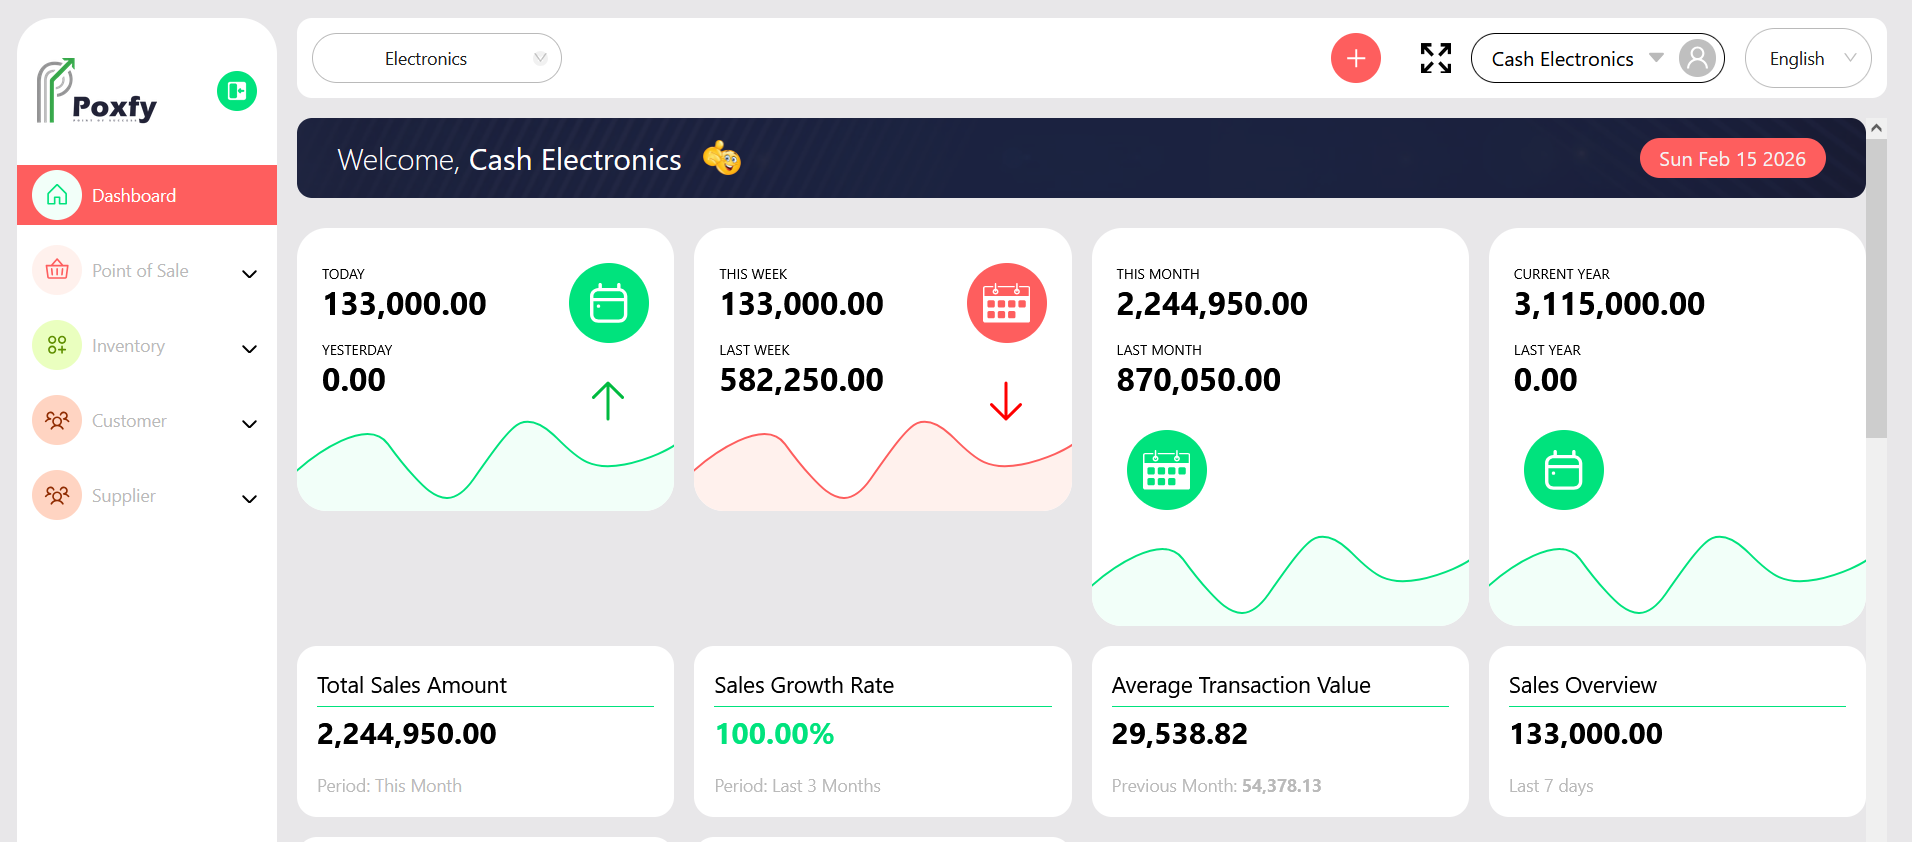
Figure 3: Poxfy Dashboard Overview
Tip: The dashboard provides a quick snapshot of your business health. For detailed analysis, refer to the Reporting section for comprehensive reports and analytics.
