
Understanding Your Poxfy Dashboard
The Poxfy dashboard is your primary hub for real-time business insights. It provides a comprehensive overview of sales performance, key metrics, and operational trends.
Key Metrics Displayed:
- Today & Yesterday: Compares today's sales with yesterday's performance.
- This Week & Last Week: Monitors weekly trends and growth.
- This Month & Last Month: Tracks monthly performance and changes.
- This Year & Last Year: Analyzes year-over-year growth.
- Sales Growth Rate: Percentage increase/decrease over the last three months.
- Average Transaction Value: The average amount a customer spends in a single transaction.
- Sales Overview: A quick snapshot of recent sales activity.
Step-by-step Instructions:
- Upon logging in, you will automatically be directed to the Dashboard.
- Review the prominent cards displaying key sales metrics for different periods.
- Observe the comparative data to understand performance trends.
- Analyze the Sales Growth Rate and Average Transaction Value for deeper insights.
- To filter dashboard data by outlet, click on the Outlet Selector in the top navigation bar and choose the desired outlet.
- Use the Quick Add button (
+) in the top bar to quickly initiate common actions.
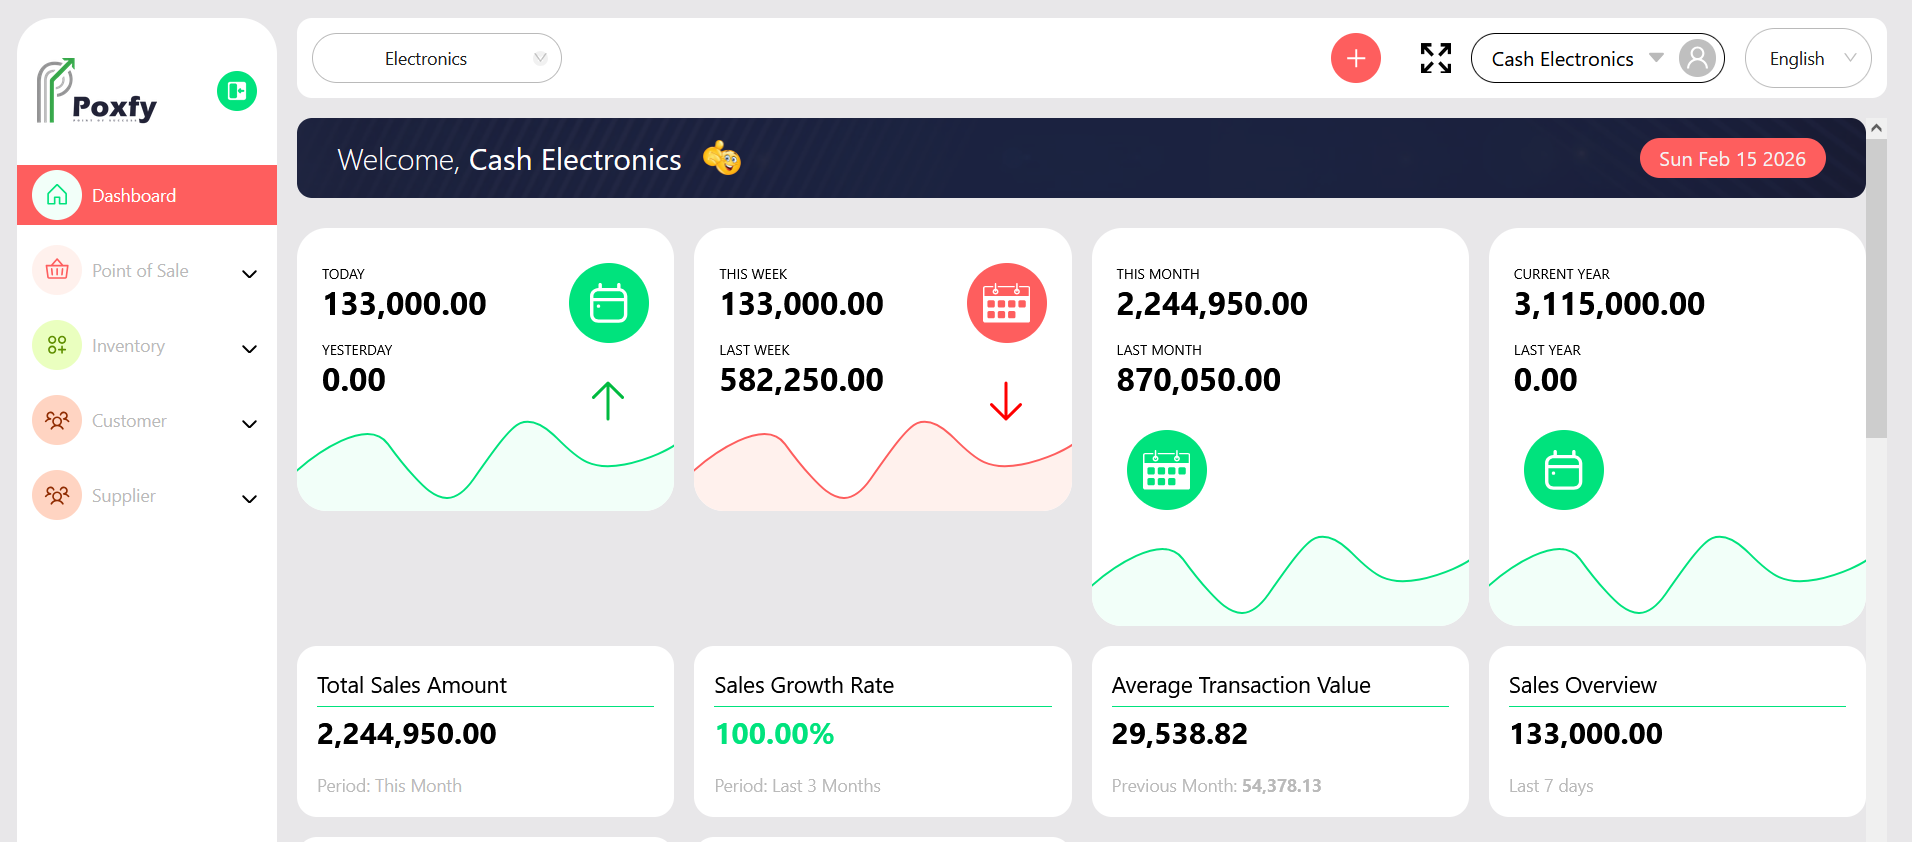
Figure 3: Poxfy Dashboard Overview
Tip: The dashboard provides a quick snapshot of your business health. For detailed analysis, refer to the Reporting section for comprehensive reports and analytics.